Keeping an eye on your numbers is one of the easiest ways to look after your heart. A blood pressure chart template gives you a simple, organized place to record every reading, spot patterns over time, and share clear information with your doctor. On this page you will find 14 free, ready-to-use blood pressure chart templates in PDF, Excel and Word formats, plus practical advice on how to fill them in and get the most from them.
Note: This page is for general information only and is not medical advice. Always talk with your doctor or another qualified healthcare professional about your blood pressure and any treatment decisions.
What Is a Blood Pressure Chart Template?
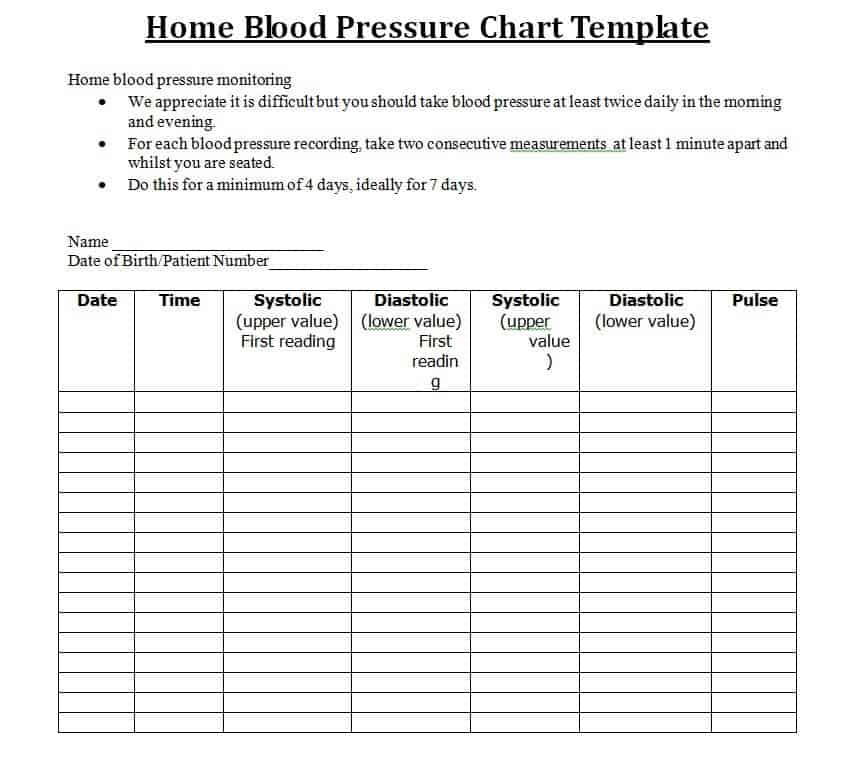
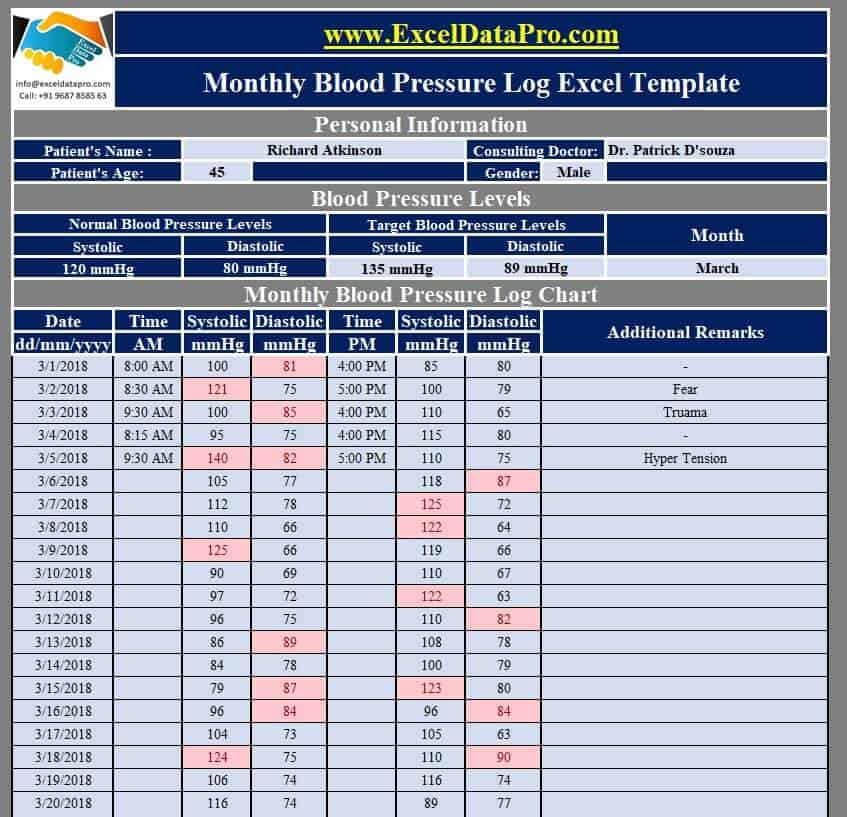
A blood pressure chart template is a pre-formatted sheet or table that lets you log your systolic (top number) and diastolic (bottom number) readings, your pulse, the date, the time of day and any notes. Some templates are simple printable logs you fill in with a pen. Others are editable Excel or Word files with built-in tables, and a few include a graph that plots your readings automatically so trends are easy to see at a glance.
Whether you use a home blood pressure chart, a weekly blood pressure log sheet or a monthly tracker, the goal is the same: consistent, readable records you can rely on.
Understanding Blood Pressure Numbers
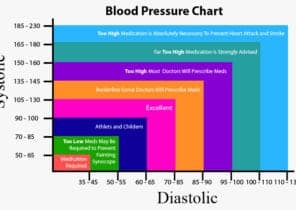
Blood pressure is measured in millimeters of mercury (mmHg) and written as two numbers, such as 120/80. The first number is systolic pressure, the force of blood against artery walls when the heart beats. The second is diastolic pressure, the force when the heart rests between beats. In general, adult readings are grouped like this:
- Normal: below 120/80 mmHg
- Elevated: 120–129 systolic and below 80 diastolic
- Stage 1 high blood pressure: 130–139 systolic or 80–89 diastolic
- Stage 2 high blood pressure: 140/90 mmHg or higher
- Hypertensive crisis: above 180/120 mmHg, which needs urgent medical attention
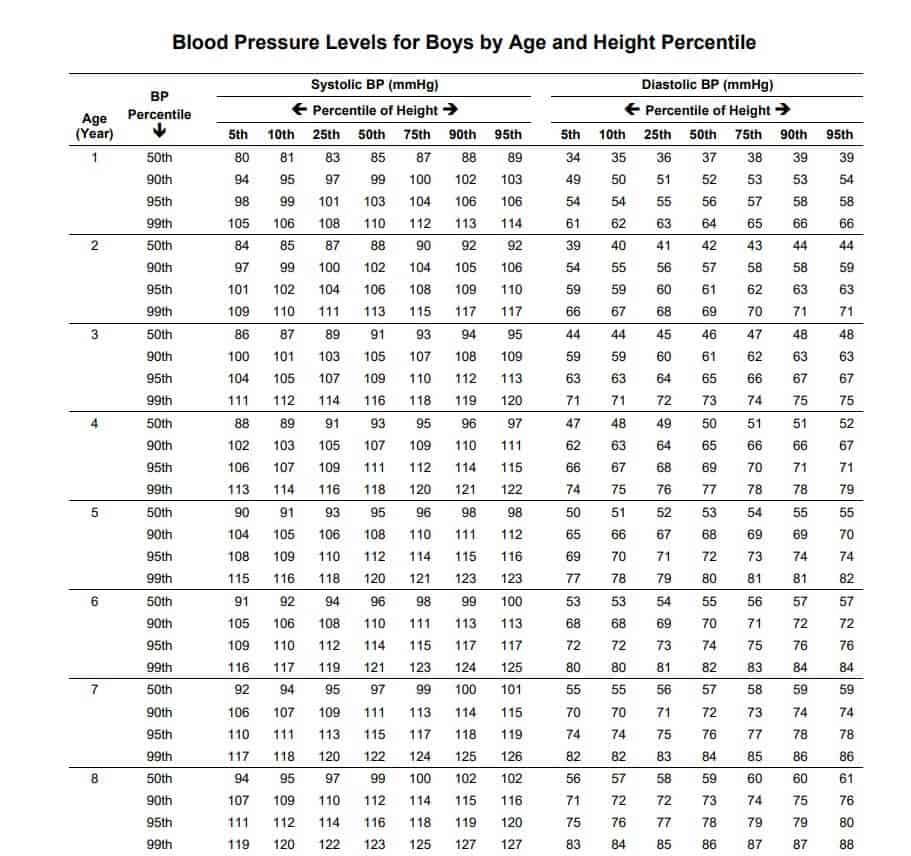
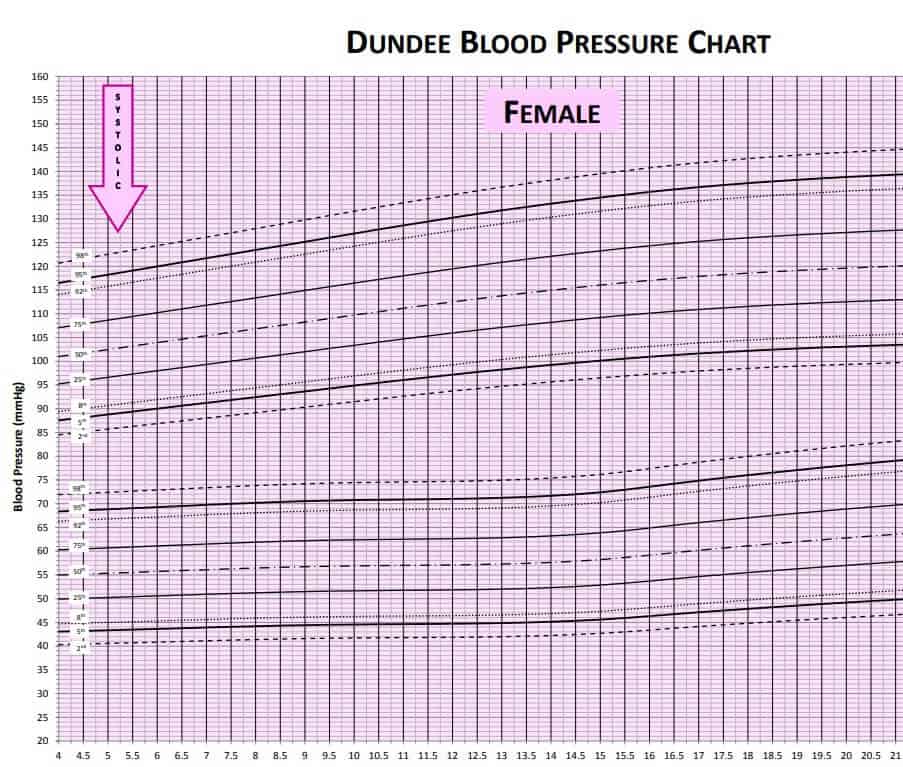
Ranges differ for children and teenagers, and they vary with age, height and sex, so a pediatric blood pressure chart, such as the boys’ level chart below, should be used with a pediatrician’s guidance.
Benefits of Tracking Your Blood Pressure at Home
Readings taken at a clinic capture only a moment in time. A home blood pressure chart shows how your numbers behave day after day, in a relaxed setting. The main benefits include:
- Spotting rising or falling trends early, before symptoms appear.
- Giving your doctor accurate data to judge whether medication or lifestyle changes are working.
- Helping you notice how sleep, salt, stress, exercise and caffeine affect your numbers.
- Avoiding “white coat” effects, where readings jump simply because you are in a medical office.
- Building a healthy habit and a greater sense of control over your own health.
Blood Pressure Chart Templates PDF
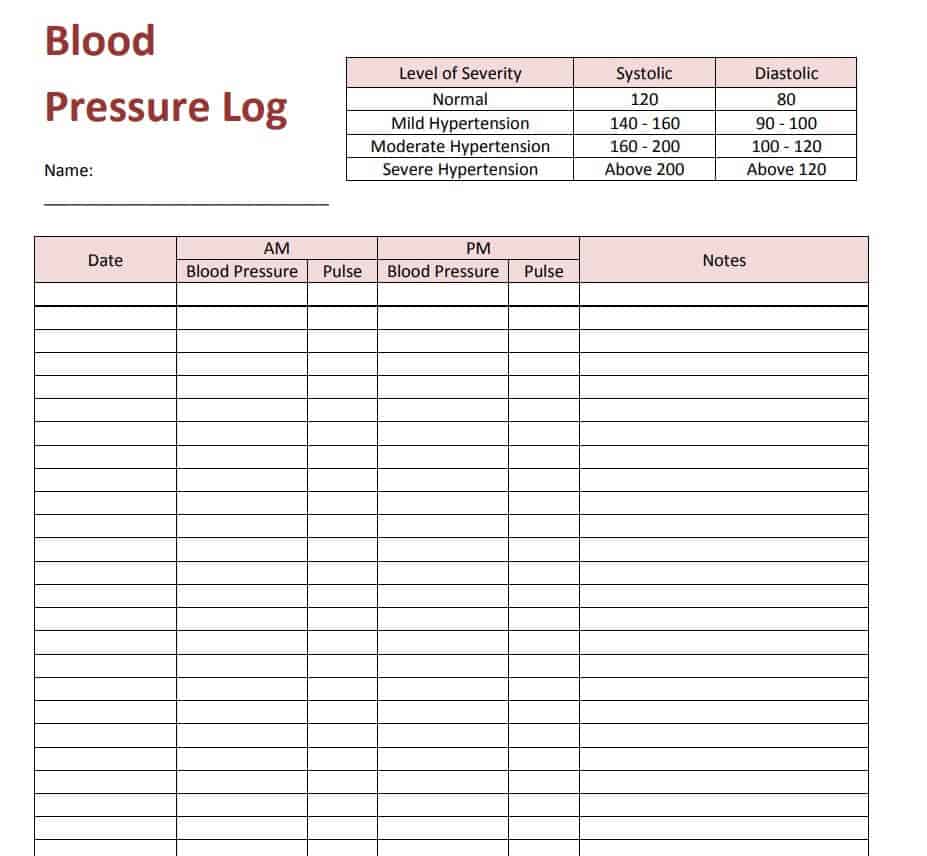
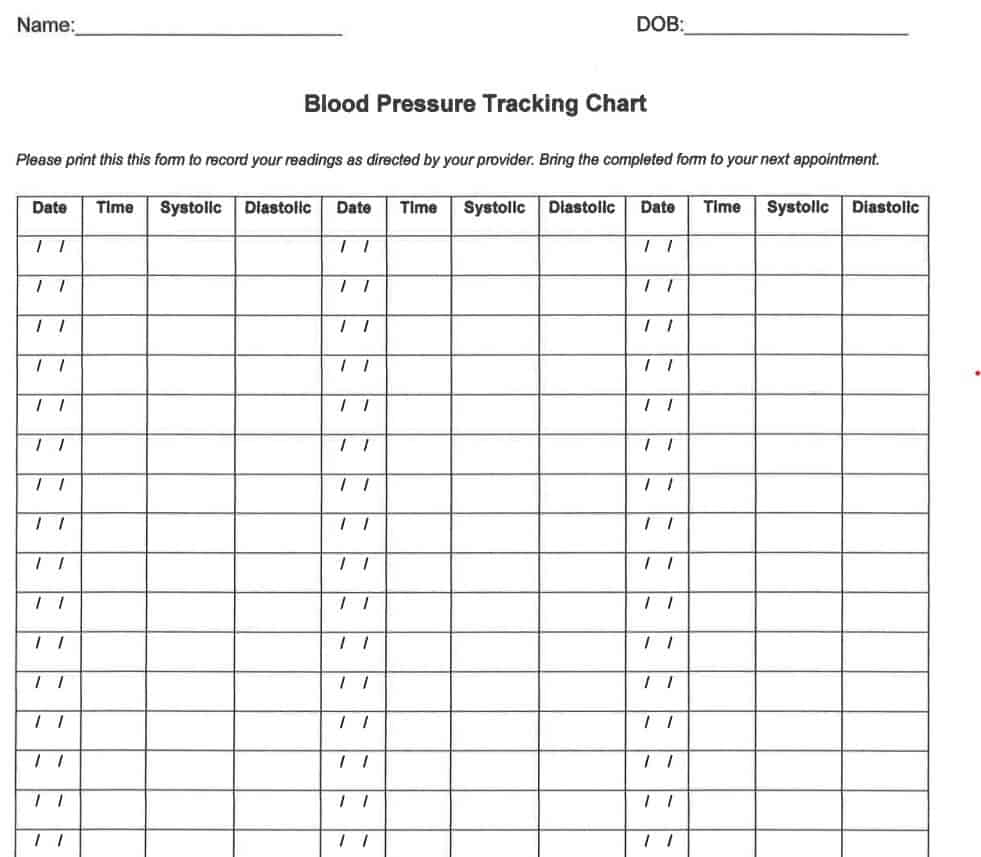
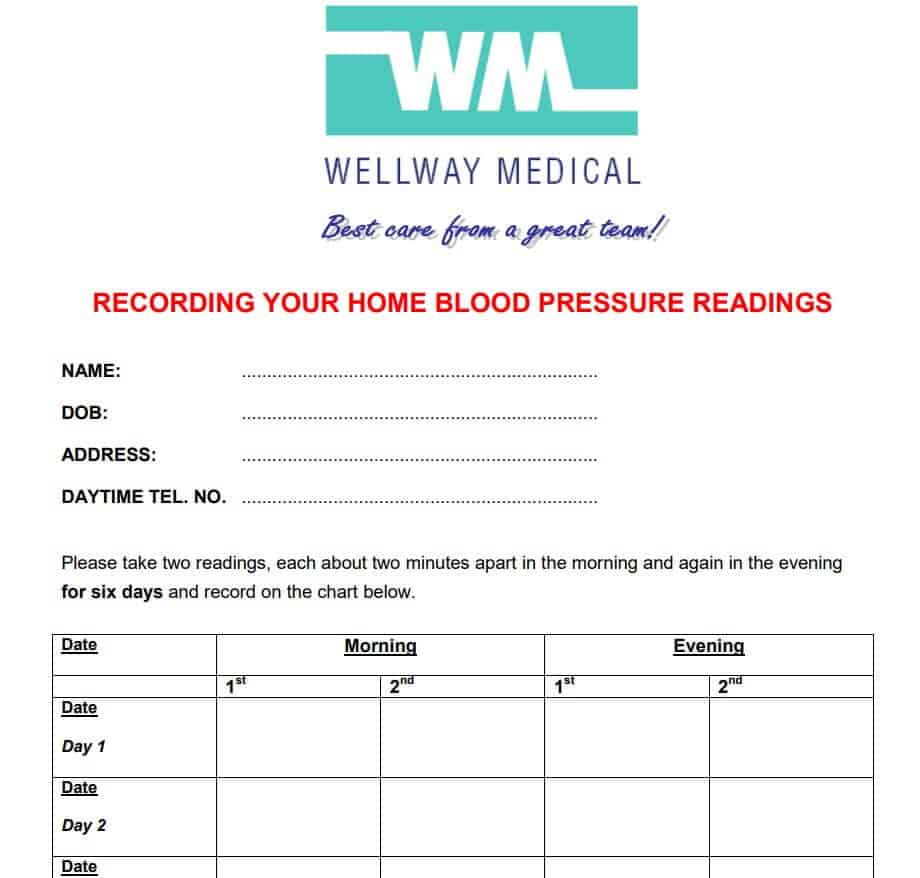
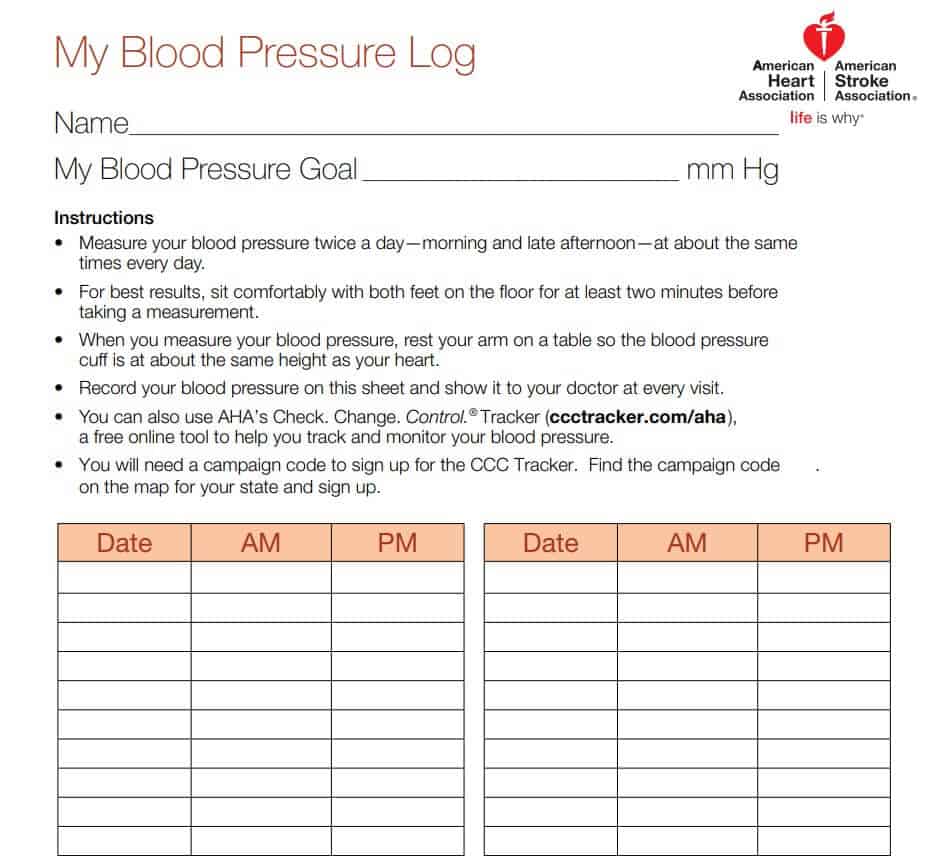
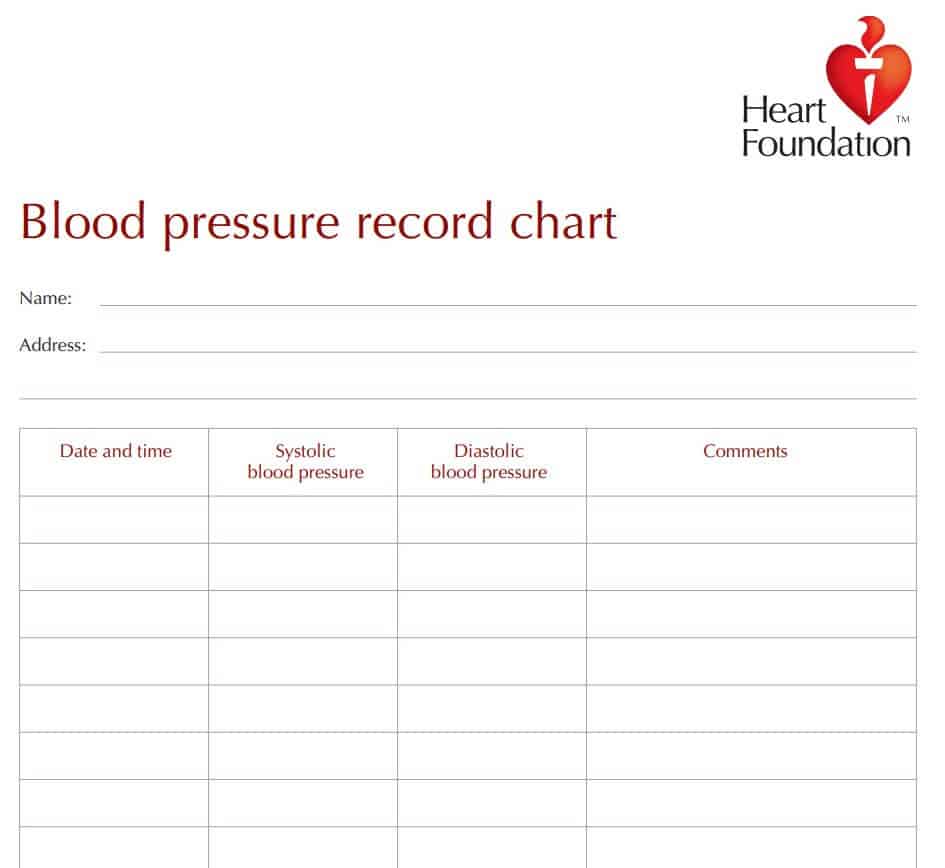
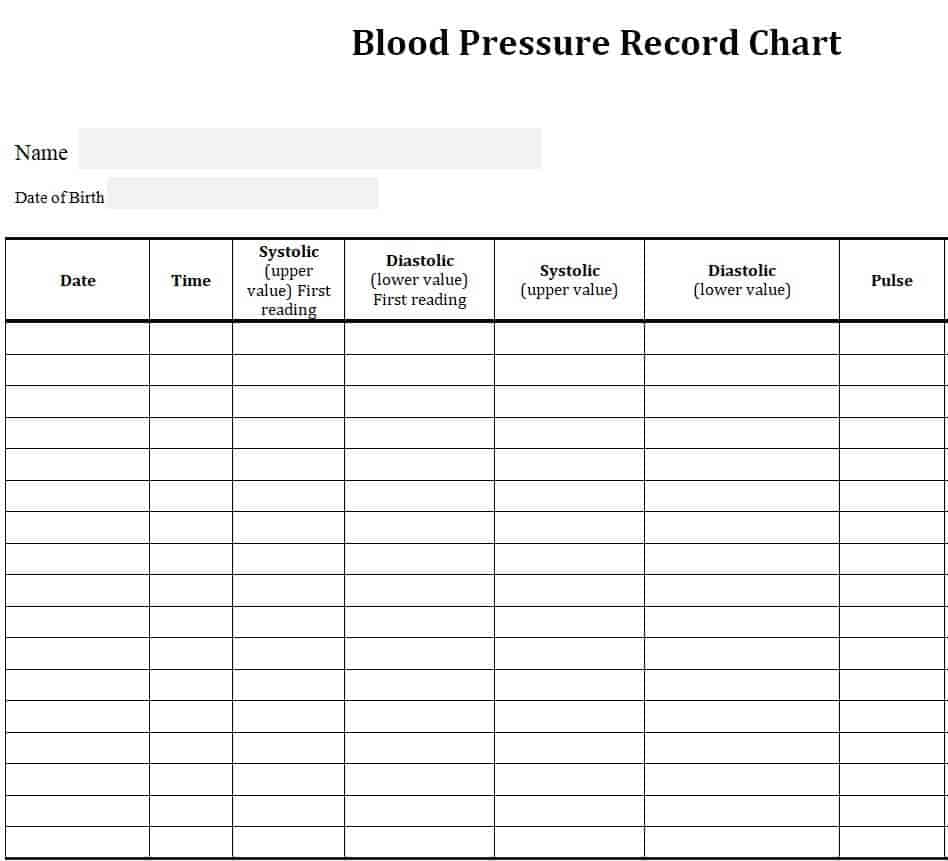
These printable PDF-style samples are perfect if you prefer to write by hand. Print as many copies as you need and keep them beside your monitor.
Editable Blood Pressure Chart Templates
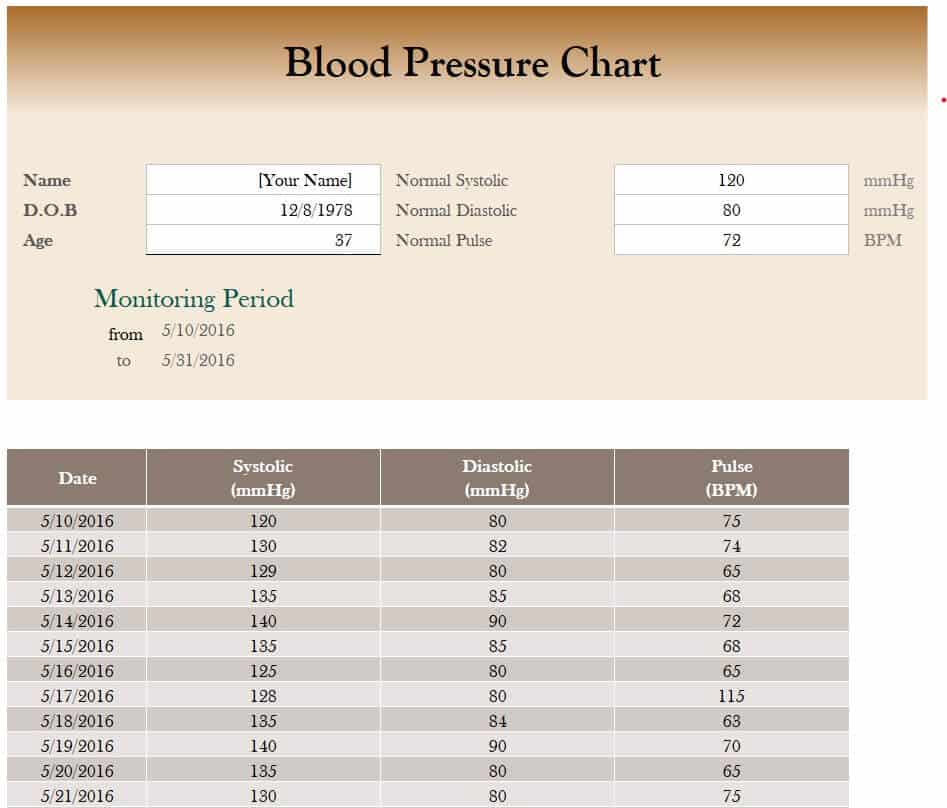
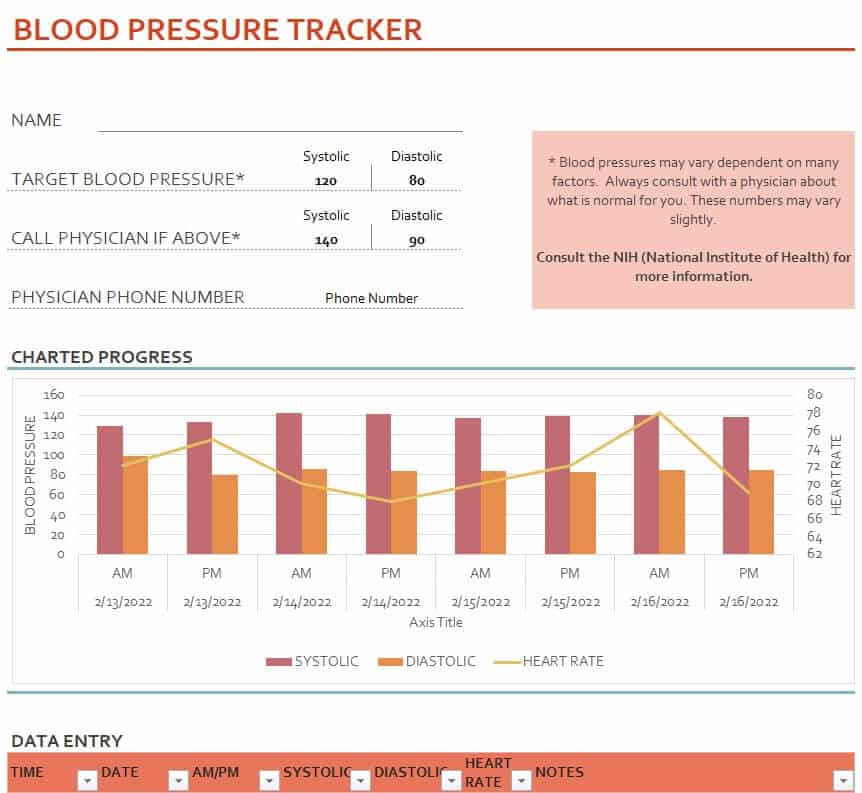
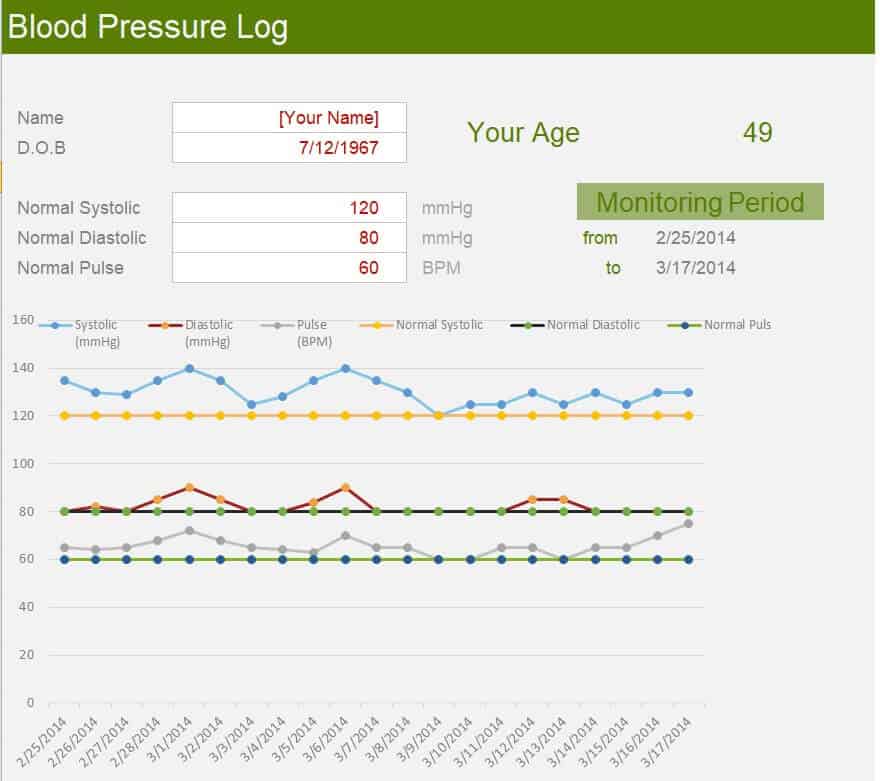
If you would rather type your readings or customize the layout, these Excel and Word templates can be edited on your computer. Add extra columns for weight, medication or symptoms, and print them whenever you need a fresh page.
What to Include in a Blood Pressure Log Sheet
A useful blood pressure log sheet is simple, but it should capture enough detail for your doctor to interpret it. Look for or add these columns:
- Date and time: readings vary through the day, so note whether it was morning or evening.
- Systolic and diastolic values: the two numbers displayed on your monitor.
- Pulse or heart rate: many home monitors show this automatically.
- Arm used and position: sitting, standing or lying down, left or right arm.
- Medication taken: record the name and time of any dose.
- Notes: stress, exercise, caffeine, poor sleep, illness or symptoms such as dizziness.
How to Record Your Blood Pressure Step by Step
- Prepare. Avoid caffeine, smoking and exercise for at least 30 minutes beforehand, and empty your bladder.
- Sit quietly. Rest for five minutes in a chair with your back supported, feet flat on the floor and legs uncrossed.
- Position your arm. Rest your arm on a table at heart level and wrap the cuff on bare skin, following the monitor’s instructions.
- Take the reading. Stay still and silent while the monitor inflates and measures.
- Repeat. Wait one minute and take a second reading, then write both down.
- Log it right away. Enter the date, time, numbers, pulse and notes on your chart so nothing is forgotten.
- Review weekly. Look for patterns and bring the chart to every appointment.
Tips for Getting Accurate Readings
- Use a validated upper-arm monitor with a cuff that fits your arm size.
- Measure at the same times each day, for example before breakfast and before bed.
- Do not talk, use your phone or cross your legs during the measurement.
- Take your monitor to a doctor’s visit once so it can be compared with clinic equipment.
- Keep older charts in a folder or a digital backup so long-term trends stay visible.
- Do not change or stop medication on your own because of a single reading.
How to Make a Blood Pressure Sheet in Excel
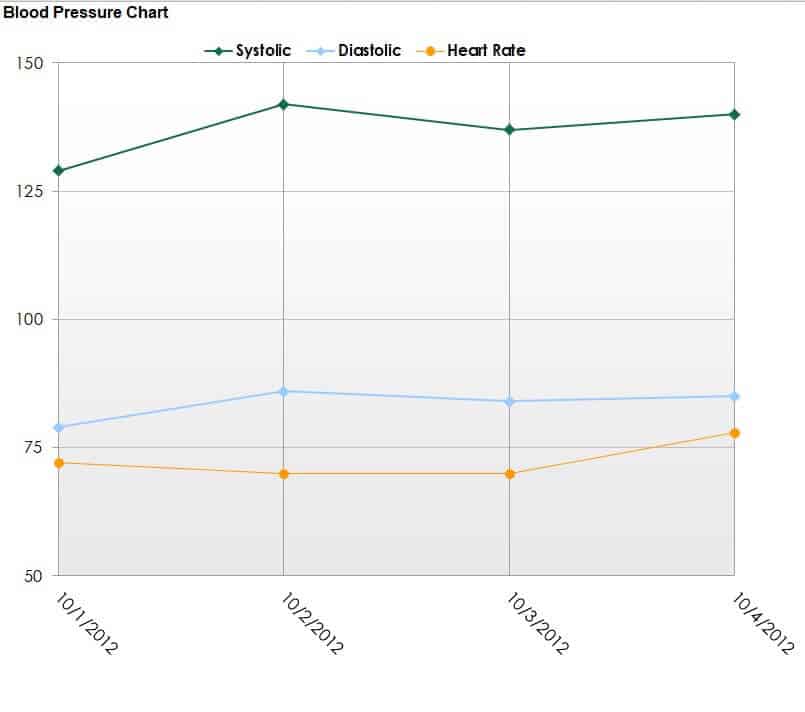
If none of the samples above fits perfectly, building your own is easy. Open a blank workbook and create headers for Date, Time, Systolic, Diastolic, Pulse and Notes. Enter your readings row by row, then select the systolic and diastolic columns and insert a line chart. Excel will plot both values over time, giving you a personal blood pressure graph. You can add conditional formatting to shade readings above 130/80 in orange or red so high values stand out immediately. Our editable Excel templates above already include this structure, so you can simply download one and start typing.
Blood Pressure Charts for Men, Women and Children
Healthy ranges are broadly similar for adult men and women, but they change with age, medical history and other conditions. Many people search for an age-wise blood pressure chart, a male or female blood pressure chart sample, or a pediatric blood pressure chart example. Use these as general guides only. Your doctor may set a personal target that is higher or lower depending on your situation, and children’s values are interpreted using percentiles for age, sex and height.
Frequently Asked Questions (FAQs)
What is a normal blood pressure reading for adults?
For most healthy adults, a normal reading is below 120/80 mmHg. Numbers from 120 to 129 systolic with diastolic under 80 are considered elevated, and readings of 130/80 or above may indicate high blood pressure. Your doctor will interpret your numbers based on your overall health.
How often should I check my blood pressure at home?
If your doctor has asked you to monitor at home, a common approach is two readings in the morning and two in the evening for about a week, then as directed. Consistency matters more than frequency, so measure at the same times and under the same conditions.
Are these blood pressure chart templates really free?
Yes. Every template on this page is free to download, print and edit for personal use. Simply click the Download button under the template you like, unzip the file and open it in Excel, Word or a PDF reader.
Can I edit these templates in Excel or Word?
The Excel and Word versions can be edited freely. You can add rows, rename columns, change fonts and colors, or include extra fields such as weight, medication and symptoms. The PDF-style samples are best for printing and writing by hand.
What is the best time of day to measure blood pressure?
Many doctors suggest measuring in the morning before medication, food or caffeine, and again in the evening. Taking readings at the same times each day makes your chart easier to compare from week to week.
Why do my readings vary from day to day?
Blood pressure naturally changes with activity, stress, sleep, diet, temperature, pain and even how you position your arm. Small variations are normal. Recording notes next to each reading helps you and your doctor understand the cause of unusual numbers.
When should I contact a doctor about my readings?
Contact your doctor if your readings are consistently above your target, or if you have symptoms such as chest pain, severe headache, shortness of breath, vision changes or weakness. A reading above 180/120 mmHg with symptoms is an emergency, so seek immediate medical care.
Final Thoughts
A consistent record turns scattered numbers into useful information. Choose the blood pressure chart template that suits your routine, download it, and start logging today. Small daily habits like this make conversations with your healthcare provider clearer and more productive, and they help you stay on top of your heart health for the long term.


You must be logged in to post a comment.